[vc_row][vc_column width=”1/1″][vc_column_text el_class=”custom_table”][dt_fancy_image style=”3″ padding=”10″ lightbox=”false” align=”left” width=”275″ margin_top=”5″ margin_bottom=”20″ margin_left=”0″ margin_right=”30″ media=”” hd_image=”” image=”http://www.spacesforchange.org/wp-content/uploads/2014/06/Untitled-1.png”][/dt_fancy_image]
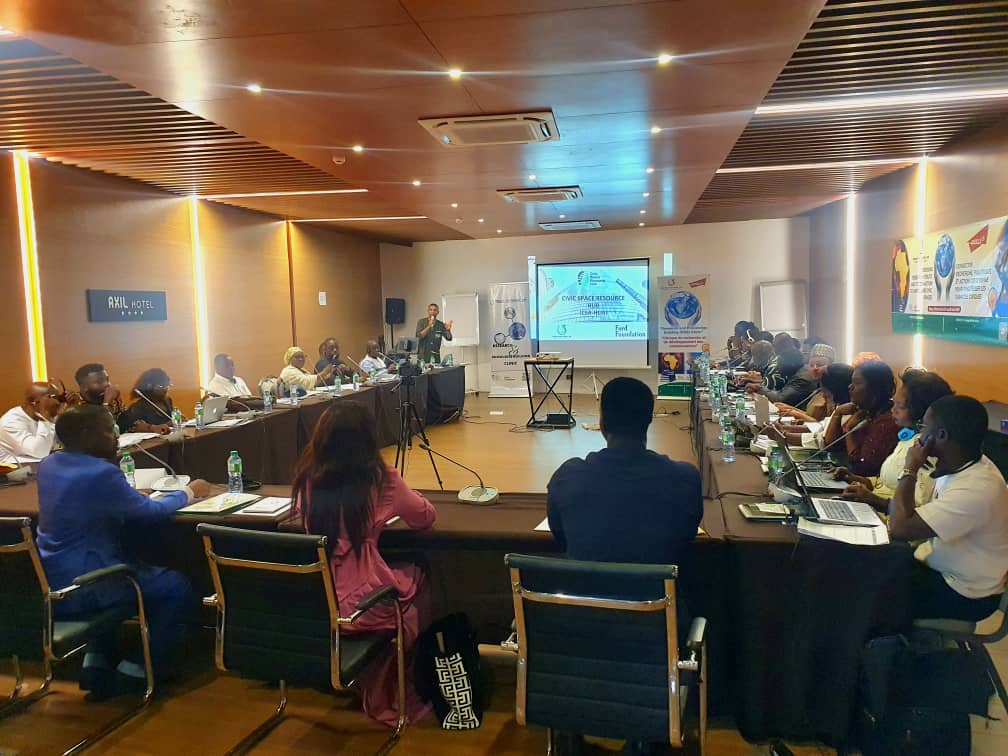
Spaces for Change.S4C’s Ilemona Onoja participated in the presentation of the Q2, Q3 & Q4 2013 job creation and employment survey by the National Bureau of Statistics (NBS). “The briefing is in line with the resolve of the NBS to present cogent and verifiable data which are necessary for policy making and business decisions”, says Statistician General of the Federation, Dr Yemi Kale. The latest statistics are neither policy material nor representative of the national policy thrust on job creation, but were figures showing the effect of existing national policies designed to bolster employment generation in the country.
The press briefing also presented an opportunity for the NBS to clarify frequently-misunderstood or often-politicized official data and statistics on job creation. As part of efforts to improve data gathering in Nigeria, the NBS revamped its organizational and administrative structures in the 36 states and set up of state-level statistical agencies, with enhanced digital capabilities in 17 states of the federation.
[dt_divider style=”thick” /]
[dt_gap height=”20″ /]
The Results
[dt_gap height=”10″ /]
The results of the survey were categorized into 3: formal, informal and public sector. Formal jobs refer to jobs in establishments that employ 10 or more people or professional services that employ less than 10 people. Informal jobs refer to jobs generated by individuals or household businesses employing less than 10 people, or business with little or no structures (eg in agriculture, wholesale or retail).
Public sector jobs refer to jobs in ministries, departments and agencies, parastatals, research and educational institutions at federal, state and local government levels. The results show that the Nigerian economy generated:
221, 054 jobs in Q2 2013
245, 989 jobs in Q3 2013 and
265, 702 jobs in Q4 2013.
[dt_gap height=”20″ /]
These are broken down thus:
| formal jobs | Informal jobs | Public sector | |
| Q2 | 80, 412 | 112, 557 | 28, 075 |
| Q3 | 76,385 | 140,673 | 28, 931 |
| Q4 | 101, 597 | 143, 278 | 20, 827 |
[dt_gap height=”10″ /]
The informal sector leads the way in job creation providing over 54% of the jobs created in the quarters covered. In the three quarters covered, employment generated were attributed to 3 main factors- business expansion, seasonal growth and new skill required.
In Q2 2013, education was the highest provider of new jobs with 37, 578 new jobs followed by manufacturing with 9, 000. Lowest was administrative and support services with 85 new jobs.
In Q3, education and manufacturing recorded the highest number of new jobs with 29, 777 and 13, 946 new jobs respectively. Admin and support was lowest again with 30.
Q4 saw this trend maintained with education and manufacturing creating 76, 874 and 12, 337 new jobs respectively.
[dt_gap height=”20″ /]
[dt_divider style=”thick” /]
[dt_gap height=”20″ /]
Partnership with Spaces for Change
[dt_list style=”2″ dividers=”true”]
[dt_list_item image=””]National census of commercial and industrial businesses. NBS will conduct this exercise in collaboration with the Central Bank of Nigeria (CBN) and the Ministry of Trade and Investment. This exercise was last conducted 20 years ago.[/dt_list_item]
[dt_list_item image=””]National Agricultural Sample Survey which is designed to collect information on agricultural production in the country. This exercise was last conducted in 1997.[/dt_list_item]
[dt_list_item image=””]
[/dt_list_item]
[/dt_list]
[dt_gap height=”20″ /]
[dt_divider style=”thick” /]
[dt_gap height=”20″ /]
Data Center Tour
[/vc_column_text][/vc_column][/vc_row]


